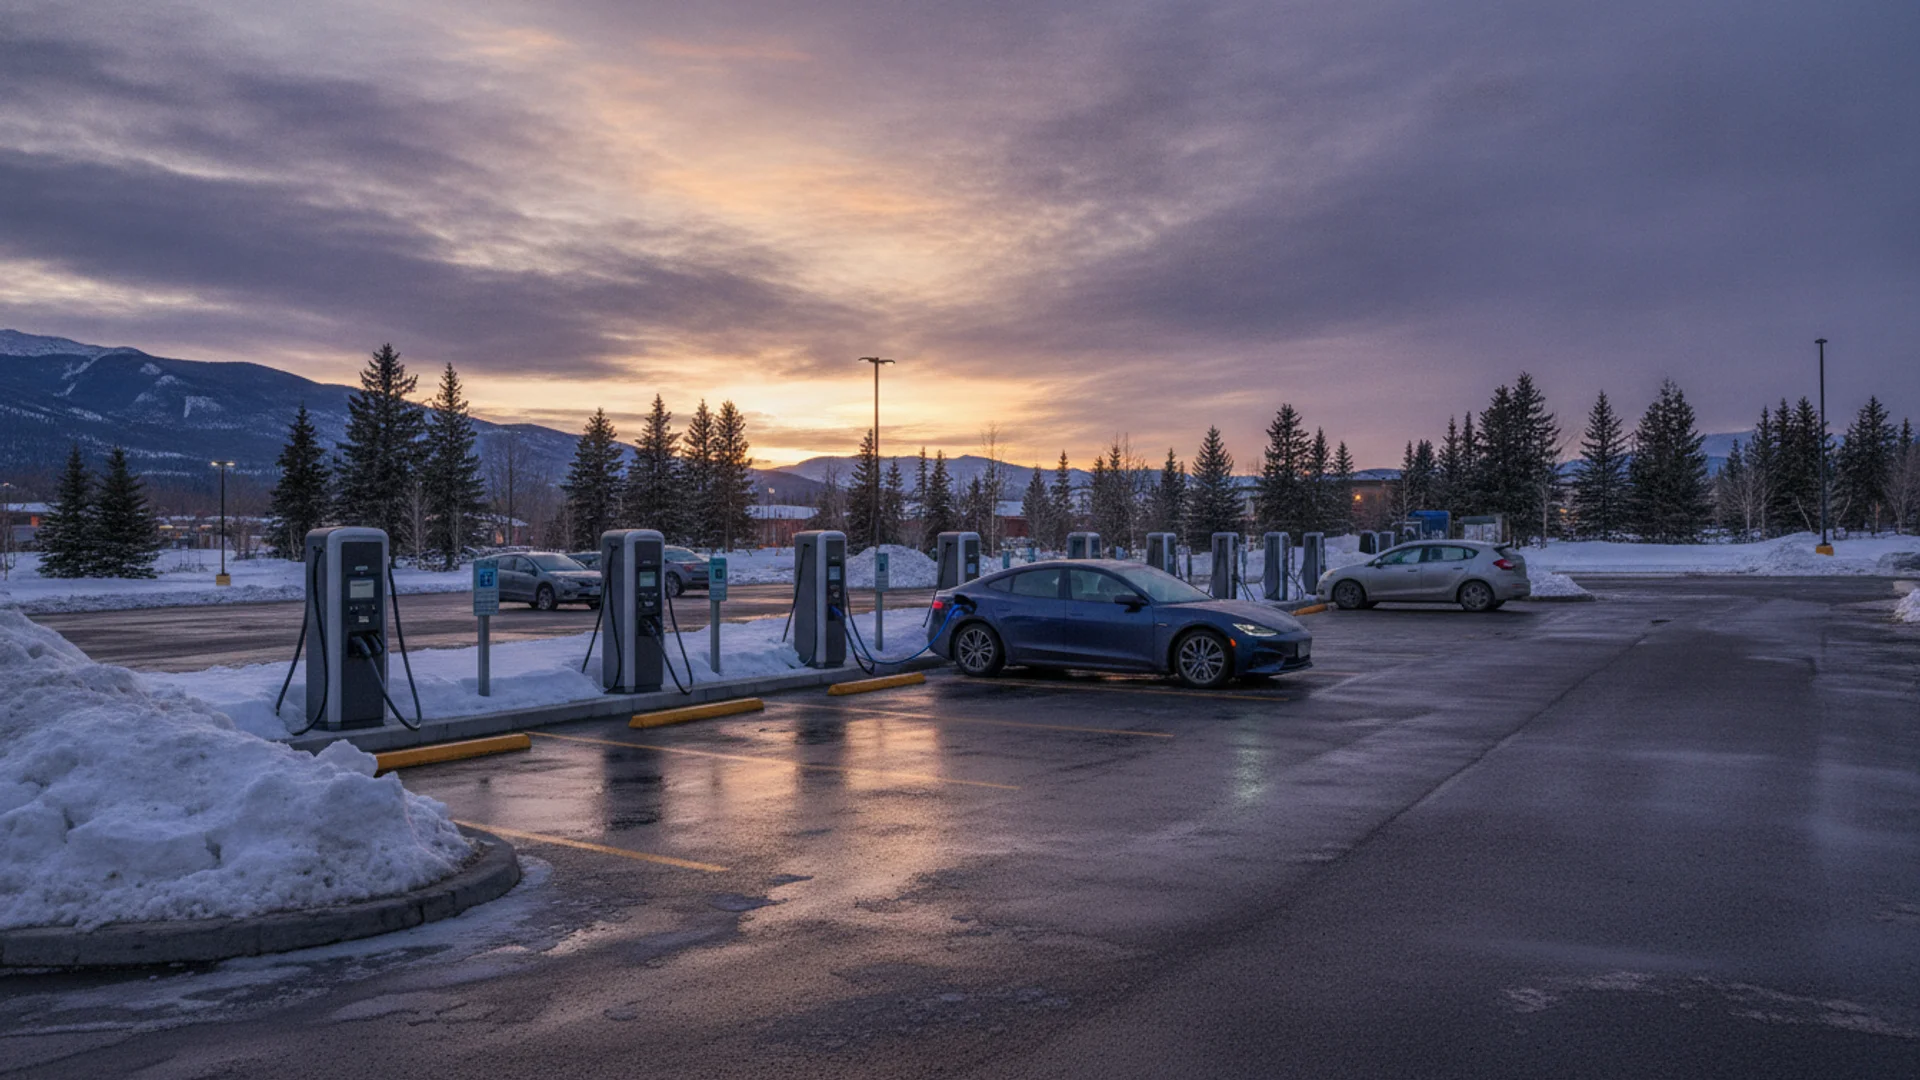
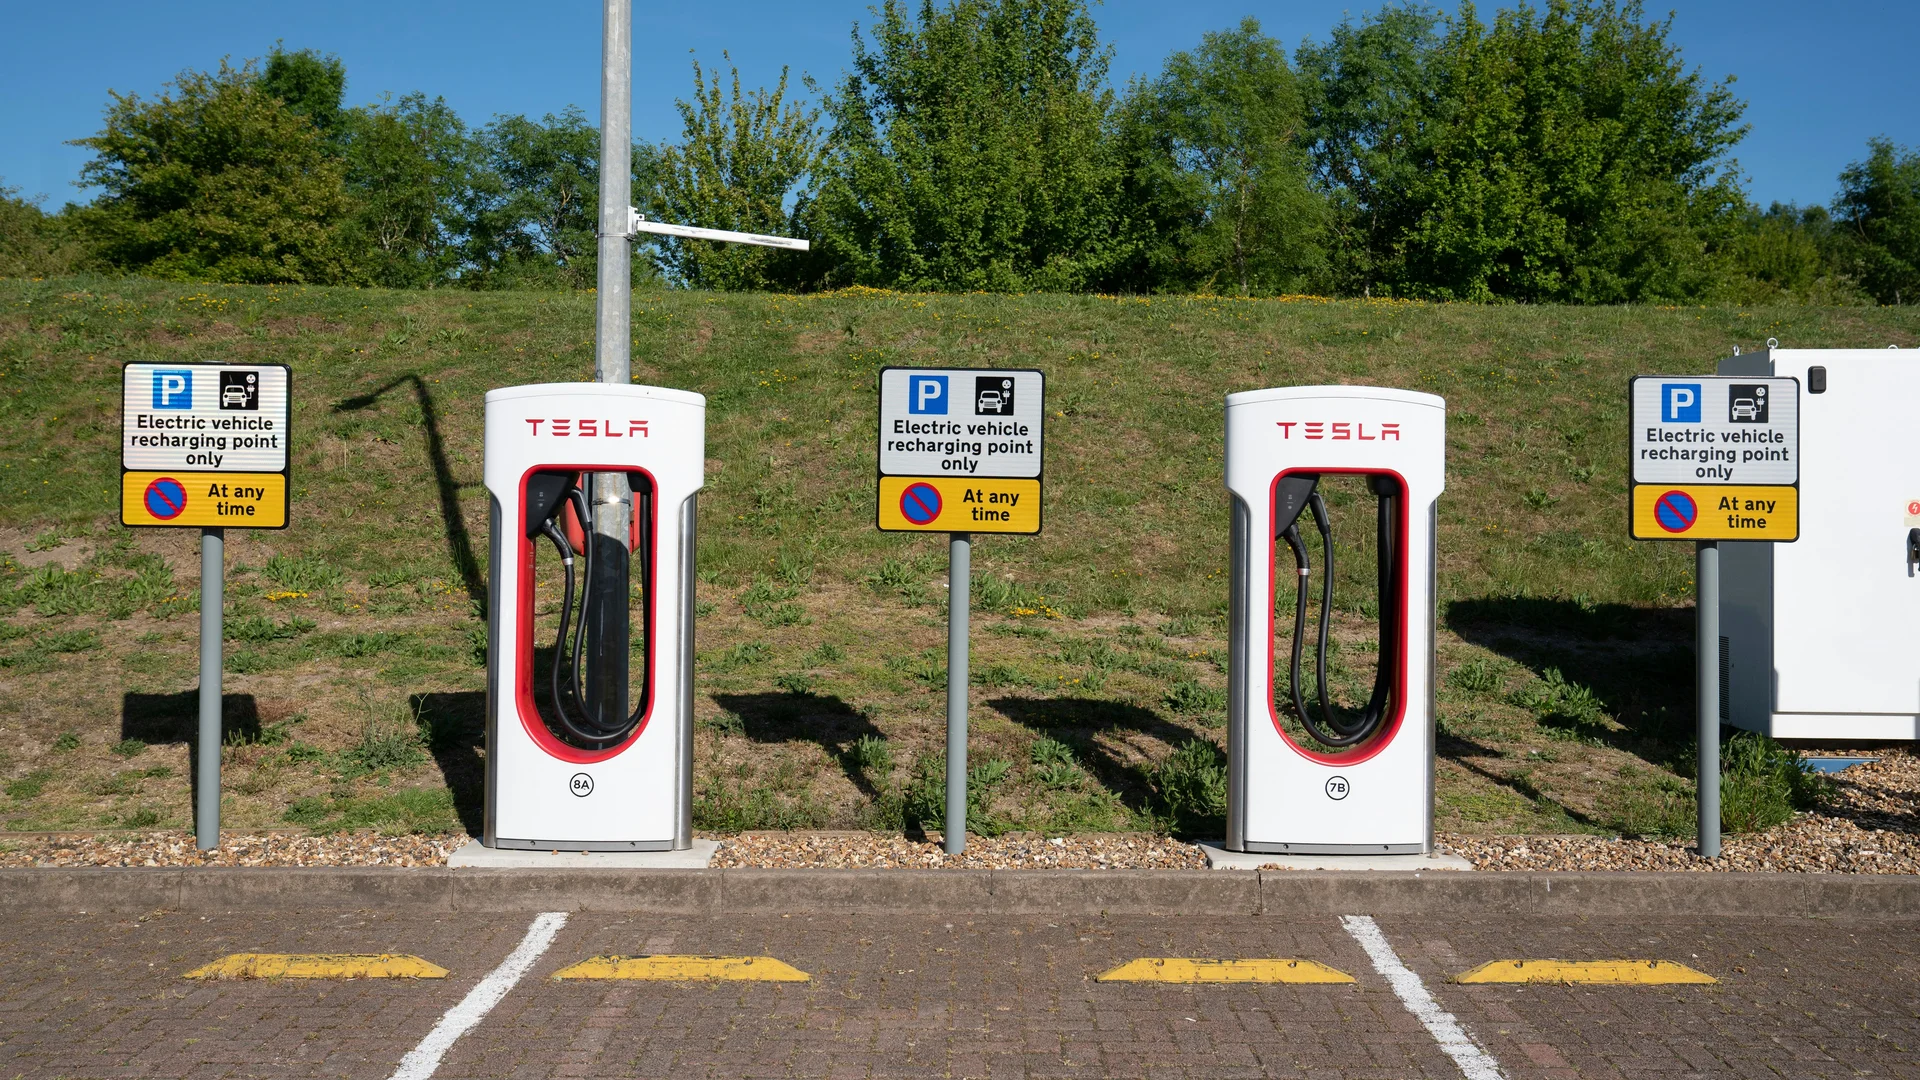
Six chargers installed. Room in the lot for twenty. A queue at noon. The visible asymmetry between empty parking spaces and installed stalls is the most common complaint in the public-charging conversation, and it has almost nothing to do with operator laziness or land scarcity. It has to do with capital ROI thresholds, utility transformer capacity, ADA bay-clearance rules, and the conditions written into federal grant programs.
The question of how many DC fast chargers belong at a single site is governed by a stack of constraints that almost never get explained in public-facing communications. Operators model incremental revenue per stall, utilities cap interconnection capacity, building codes mandate accessible bays, and federal funding programmes define both floors and ceilings on stall count.
The people who think operators are leaving free money on the table by under-building are reading the wrong financial model. Stall count is bounded long before the asphalt gets poured.
Key takeaways
- Electrify America's original $2 billion network was built to satisfy a Dieselgate consent decree, not serve actual EV demand.
- A DC fast charger costs $50,000–$150,000 fully installed; stall count cuts off when marginal revenue no longer clears that capital.
- Sites below roughly 10–15% utilisation cannot justify adding stalls, even when adjacent parking spaces sit empty.
- Post-consent-decree EA has shifted to ROI-driven siting, which is why newer urban stations queue while legacy Wyoming sites sit empty.
- Operators model 8,760 annual hours of average utilisation, not the holiday-weekend noon queue drivers are actually sitting in.
Gear worth having
As an Amazon Associate, ThinkEV earns a small commission from qualifying purchases — at no extra cost to you.

TP-Link Kasa Smart Plug with Energy Monitoring
Track exactly how much electricity your Level 1 charger uses and schedule it for off-peak hours. Know your real cost per kWh.
As an Amazon Associate, ThinkEV earns from qualifying purchases — at no extra cost to you.
The Capital Model: Why Revenue Per Stall Determines Stall Count
A 150 kW DC fast charger costs an operator somewhere between $50,000 and $150,000 to install in fully-loaded terms, hardware, trenching, switchgear, transformer share, installation labour, and commissioning. That range is the figure most network operators cite internally and most academic studies cite externally; the spread reflects whether the site host pre-trenched conduit, whether the transformer existed, and whether the local utility charged a contribution-in-aid-of-construction fee.
The relevant operator question is not "how many stalls fit on this lot." It is: at what point does the incremental capital outlay for stall N+1 stop generating positive net present value? That math is brutal. A stall sitting idle 85% of the day cannot pay back $100,000 in capital plus demand charges plus network fees plus maintenance plus payment-processing inside the seven-to-ten-year horizon most charging companies model against.
Electrify America's own deployment pattern reflects this calculus. Utilisation data on legacy corridor stations in low-density western regions has consistently shown long stretches of idle capacity, particularly west of the Mississippi. That is not anecdotal noise, drivers crossing the country in EVs have publicly reported that almost all the EA stations were deserted west of the Mississippi, and that pattern is the visible artifact of an under-utilised network in low-density corridors. When utilisation runs below roughly 10 to 15 percent, the rule-of-thumb threshold most operators use before justifying expansion, adding stalls is value-destroying, not value-creating.
The mathematics of stall count looks like this. A six-stall site at 15% utilisation generates a known revenue ceiling. Doubling the stall count to twelve does not double the revenue. It adds capacity for peak demand the site rarely sees. Capital exposure doubles, the demand-charge base doubles, and the operations footprint roughly doubles with it. Operators model this as marginal revenue per stall against marginal cost per stall, and at most sites the marginal calculation cuts off before the visible parking lot does.
The case against this framing deserves a hearing. A reader could argue that operators are too conservative, that demand will grow faster than the seven-year ROI window assumes, and that under-building today guarantees queues tomorrow that drive customers back to gasoline. The rebuttal is that operator financing is not patient capital. The lenders behind a charging network do not underwrite a ten-year demand-growth thesis; they underwrite a five-to-seven-year debt-service coverage ratio, and the stall count that clears that ratio is the stall count that gets built. The concession to the critic is real, though: if EV adoption accelerates faster than financing models assumed, the network will be visibly under-built for a window of two to four years before capital catches up. That window is what the driver in the queue is sitting in.
The misread that drivers make at the queue is understandable. From the seat of a car waiting for a stall, the right number always looks higher. But the operator is not modelling the wait at noon on a holiday weekend. The operator is modelling the average utilisation over 8,760 hours per year, the demand-charge spikes the local utility will bill against, and the depreciation curve of a hardware platform that will be obsolete in ten years. The right stall count from the queue is rarely the right stall count from the spreadsheet.
The honest version of this is that operators are conservative on stall count because the capital is real and the demand is lumpy. A site that pays back in seven years at six stalls might pay back in twelve at ten stalls, and twelve years exceeds most operators' financing horizons. The reader who wants to understand why a station looks under-built should start there.
Electrify America's Mandate Origins and Their Constraint on Deployment Strategy
Electrify America was not founded as a normal commercial venture. It was created in 2016 as the corporate vehicle through which Volkswagen Group would discharge a $2 billion environmental remediation obligation under the Dieselgate consent decree negotiated with the United States Environmental Protection Agency and the California Air Resources Board. The settlement structure mandated four sequential investment cycles. EA's internal lexicon refers to these as ZEVIP 1 through 4. These cycles are entirely distinct from the Canadian Zero Emission Vehicle Infrastructure Program, which shares the acronym but operates under Natural Resources Canada with completely separate rules.
The consent decree's controlling design principle was geographic equity. EA was required to deploy charging infrastructure across both ZEV-mandate states and non-ZEV states in proportions defined by the settlement. That meant capital flowed to corridors that did not yet have meaningful EV adoption, because the settlement was about remediating harm at national scale rather than serving the densest near-term demand. This is the structural reason why the EA network looks irrational under pure market logic in low-density western corridors. It was not built for current demand. It was built to satisfy a court-supervised settlement obligation.
The strategic posture changed materially once the original $2 billion was deployed. Post-consent-decree EA, still owned by Volkswagen Group and now operating under more conventional commercial governance, has shifted to ROI-driven siting. Newer stations cluster where the operator can demonstrate utilisation forecasts that justify capital outlay. The legacy network, the sites that look strangely empty in Wyoming or rural Nebraska, is what remains from the mandate era.
That bifurcation matters for the reader's question. Stations built between roughly 2017 and 2022 reflect settlement geography, not commercial logic. Stations being added now reflect commercial logic. The two cohorts behave differently because they were built under different rules, and the visible queue at a peak-demand urban site reflects the second cohort's tighter ROI discipline. If a six-stall site is in a major metro and constantly queued, that is the new-era EA showing the capital discipline that the settlement-era EA did not have to apply.
This is also why comparisons between EA and other networks, EVgo, ChargePoint, Tesla, Blink, break down at the deployment-pattern level. Blink, for instance, has cycled through ownership, business-model pivots, and even an announced integration of cryptocurrency payments, all without the runway of a consent decree to absorb the cost of mis-sited capital. EA's site-selection history is overlaid on top of a mandate; the others had to make every stall earn its keep from day one. Anyone analysing why a specific EA station has six chargers rather than ten needs to know which cohort the station belongs to before drawing a conclusion about the operator's judgement.
The stripped-down version is this: the settlement gave EA a runway no commercial competitor had, and a constraint set no commercial competitor faced. Both shaped stall count. Neither is fully discharged from the deployment data even today.

Gear worth having
As an Amazon Associate, ThinkEV earns a small commission from qualifying purchases — at no extra cost to you.
Wallbox Pulsar Plus 48A Level 2 Charger
Compact, sleek charger with app control and power sharing for two EVs. 48A / 11.5 kW, NEMA 14-50. Looks as good as your EV.
As an Amazon Associate, ThinkEV earns from qualifying purchases — at no extra cost to you.
Grant Conditions and Government Program Requirements Across Jurisdictions
The federal funding architecture for public DC fast charging in North America has created stall-count floors that did not previously exist. In the United States, the National Electric Vehicle Infrastructure formula programme, established under the Bipartisan Infrastructure Law and administered by the Federal Highway Administration, requires that funded sites along Alternative Fuel Corridors include a minimum of four DC fast-charging ports, each capable of delivering at least 150 kW simultaneously when all four are in use. That is a floor, not a ceiling, but it has become the de facto template for federally-supported corridor sites.
The four-by-150 NEVI floor explains why so many recent US fast-charging announcements describe identical site configurations. The funding requires it. Operators applying for NEVI dollars cannot propose a two-stall site or a four-stall site with three stalls at 150 kW and one at 50 kW. The configuration is locked at the application stage, and altering it after the grant is awarded triggers re-application.
Canada's ZEVIP programme operates under different rules but produces analogous effects on stall count. ZEVIP funds up to 50 percent of eligible project costs and applies different stall minimums depending on whether the site is on a designated corridor, in an urban centre, or in an underserved community. The cap of approximately $500,000 per site for fast-charging projects bounds the maximum stall count the grant can support, not because the operator cannot build more, but because the remaining capital has to come from operator equity or host-site contribution.
Gear worth having
As an Amazon Associate, ThinkEV earns a small commission from qualifying purchases — at no extra cost to you.

Grizzl-E Classic Level 2 EV Charger (40A)
Canadian-made and rated for minus 40C winters. 40A / 9.6 kW, NEMA 14-50, indoor/outdoor, 24-ft cable. The charger built for Canadian weather.
As an Amazon Associate, ThinkEV earns from qualifying purchases — at no extra cost to you.
The European Union's regulatory regime has gone further. The Alternative Fuels Infrastructure Regulation, which entered into force in April 2024, mandates that rest-area charging pools along the Trans-European Transport Network core corridors deliver an aggregate 400 kW of charging power by the end of 2025, rising to 600 kW by 2027, with at least one charger capable of 150 kW. This is a power floor, not a stall floor, but the practical effect is identical: the regulation forces minimum capacity at each site along the designated network. EU operators cannot under-build a corridor station the way US operators could before NEVI.
The cross-jurisdictional comparison reveals an underappreciated truth. Stall count at federally-supported sites is not primarily an operator decision. It is a grant-condition decision. The operator submits an application that specifies stall count, kW per stall, network operability, and uptime guarantees. The funding agency approves or rejects. Adding stalls later requires a new grant cycle, which is one reason station expansions lag station openings, the funding mechanism is structured around new builds, not retrofits.
For the driver in the queue, this means the visible six-stall site may not be six stalls because the operator wanted six. It may be six stalls because that was the number the grant supported, the host approved, and the utility could deliver. The honest version is that the funded floor and the funded ceiling are usually very close together.
Host-Site Agreements and Land Constraints: What the Parking Lot Actually Allows
The retail-host partnership model is where the financial logic of stall count meets the physical reality of the parking lot. Electrify America's published location agreements with Walmart, Target, and Simon Property Group define stall counts, lease footprints, and revenue-sharing terms inside multi-year contracts. The contractual stall count is fixed at signing, and the host has commercial reasons to keep it low.
A retail host's primary business is retail. Commercial entities such as stores and restaurants, office complexes, educational institutions, and even condo associations can capitalize on available real estate, the parking lot, to boost revenue or attract and retain customers. But the parking lot also exists to serve the host's core customers buying groceries, household goods, or apparel. Every parking stall converted to an EV-only bay reduces general-customer parking inventory. For a high-traffic suburban Walmart, the loss of twenty general parking stalls during a holiday weekend is a measurable customer-experience cost, and the host has every incentive to negotiate the EV stall count downward at lease signing.
Revenue-share terms influence the renegotiation pace. EA's typical structure shares charging revenue with the host or pays a flat lease, with escalators tied to utilisation. A host watching their EV bays sit empty for most of the day has limited incentive to expand the footprint, even if the operator wants to. A host watching their EV bays generate steady revenue at peak times has incentive to renegotiate, but renegotiation cycles in commercial real estate run on the order of years, not months.
The physical site constraints compound the contractual ones. ADA circulation paths, fire-code setbacks from buildings and fuel-handling equipment, electrical equipment exclusion zones around transformers and switchgear, and stormwater drainage requirements all reduce the usable EV bay count below the visible open space in the lot. A site that looks like it could hold twenty chargers may have, after subtracting these mandatory setbacks, capacity for ten. The driver at the queue is not seeing the constraint map, they are seeing the residual asphalt.
Canada's deployment trajectory reflects similar pressures. The expansion of DC fast charging continues to outpace Level 2 installations, rising nearly 33.6 per cent over the past 12 months, compared to the 13.5 per cent increase in Level 2 chargers. That headline growth rate, however, reflects new locations rather than deeper per-site stall density. Per-site stall density has lagged corridor expansion across Canada in a pattern that mirrors the US experience: it is easier to win grant approval and host approval for a new site at four stalls than for an expansion of an existing site to eight stalls.
For deeper context on how Canada's DCFC network is actually performing at the corridor level, the reader can see whether EV road-tripping across Canada is viable in 2026, the per-stall queue dynamics on the Trans-Canada Highway and the Quebec-Windsor corridor show the same pattern this section describes. The number of locations is growing faster than the depth of any given location.
The pattern across all jurisdictions: the host wants to preserve parking, the operator wants ROI, the regulator wants accessibility, and the utility wants predictable load. The intersection of these four wants is rarely the maximum stall count the lot could physically hold.
Gear worth having
As an Amazon Associate, ThinkEV earns a small commission from qualifying purchases — at no extra cost to you.

Lectron Level 2 J1772 Charger (40A, WiFi)
Smart WiFi charger with real-time energy monitoring. 40A / 9.6 kW, J1772 with a NEMA 14-50 plug, schedule charging right from your phone.
As an Amazon Associate, ThinkEV earns from qualifying purchases — at no extra cost to you.
What Drives Capacity Expansion at an Existing Site
The conditions under which a six-stall site becomes a twelve-stall site are narrower than most observers assume. Operators monitor utilisation data per stall per hour, and the internal threshold for triggering an expansion-planning study is typically sustained peak-hour utilisation above 20 percent, not average daily utilisation. A site that hits 80 percent utilisation for two hours on a Friday evening but sits idle the rest of the week generates the queue complaint, but does not necessarily clear the expansion-planning threshold.
When the threshold is cleared, utility upgrade completion, not the operator's decision, becomes the rate-limiting step. As covered earlier, transformer lead times and interconnection-queue durations dominate the expansion timeline. Operators have publicly noted expansion projects waiting eighteen to thirty months for utility milestones to clear before construction can begin.
NEVI and ZEVIP funding rounds create discrete windows where expansion applications can be bundled with new-site applications. An operator with a high-utilisation existing site is incentivised to apply for new-site grants in adjacent corridors and use the bundled application to fund peripheral expansion at the saturated site. This is one reason expansion announcements often cluster around funding-cycle deadlines rather than around demand inflection points. The grant calendar shapes the build calendar.
Canada's DCFC growth pattern reinforces the same point. The 33.6% year-over-year DCFC expansion rate reported by Electric Autonomy in 2026 reflects new locations along corridors served by FLO, Electrify Canada, Petro-Canada, and others. But it's not enough to track the number of chargers, three indicators give additional insight into whether Canada's charging network is expanding in the right ways, and per-site stall depth is the indicator that the headline growth rate consistently understates. For drivers wondering what this growth means at the corridor level, Tesla and EVgo's expanding fast-charging footprint across Canada frames the question of whether new locations or deeper sites matter more for a given road-trip use case. The neighbouring debate over whether FLO's Level 2 dominance in Ontario translates into DCFC density is the Canadian equivalent of the EA-versus-Tesla comparison happening in the US.
What would change the trajectory? Three signals are worth watching over the next eighteen months. First, whether the next ZEVIP funding round in Canada raises the per-site cap above $500,000, that single change would unlock measurably deeper per-site density. Second, whether NEVI's reauthorisation conversation in the US moves the four-stall floor higher or introduces tiered floors for high-traffic corridors. Third, whether utility-side reform, particularly faster interconnection studies and pre-approved transformer staging, accelerates the post-grant build timeline.
The bet I would make is on Canada moving first on the grant cap and the EU moving fastest on the regulatory floor. The US will follow on grant conditions, but the utility interconnection bottleneck is a structural problem no charging programme can fix unilaterally. What would change my mind: a single NEVI-funded site clearing twelve stalls at 350 kW within an eighteen-month build window, or a ZEVIP round that funds a documented expansion-retrofit rather than a new build. Either would signal that the floor-and-ceiling regime is loosening. Absent those signals, the driver at the queue should expect the visible six-stall site to look the same in two years, and should expect the network to expand by adding new six-stall sites a few exits away, rather than by doubling the depth of the one they are sitting at.
For wider context, see ev charging on road trips across canada, is it viable yet and ev charging etiquette: 10 unwritten rules every canadian driver should know.
The stall count is a financial model wearing a hard hat. The hat is real, and the model is not changing soon.
Gear worth having
As an Amazon Associate, ThinkEV earns a small commission from qualifying purchases — at no extra cost to you.

ChargePoint Home Flex Level 2 Charger (50A)
Premium 50A / 12 kW charger with the best app ecosystem. Hardwired or NEMA 14-50, with real-time energy tracking and smart scheduling.
As an Amazon Associate, ThinkEV earns from qualifying purchases — at no extra cost to you.

Founder & Chief Editor
Vlad Pereira is the founder and chief editor of ThinkEV.ca, based in Courtenay on Vancouver Island, British Columbia. He covers the global EV industry with a Canadian editorial lens — independent analysis, honest comparisons, and practical tools for drivers at every stage of the …
Frequently asked questions
Why do some Electrify America stations in Western Canada look deserted?
Could operators just add more stalls later when demand grows?
Do federal grants in Canada require a minimum stall count?
What share of the day does a stall need to be in use to justify expansion?
Are ADA bay requirements a significant factor in final stall counts?
More EV & road-trip finds
Affordable upgrades worth a look — tap any to check the price on Amazon.
 ★ 2,941
Microfiber Cleaning Cloths (Multi-Pack)
View on Amazon ★ 419
★ 419RGB Car Interior LED Strip Light
View on Amazon ★ 401
★ 401Crochet Daisy Rear-View Mirror Charm
View on Amazon ★ 27,769
Car Cup Holder Coasters (4-Pack)
View on Amazon ★ 297
★ 297360-Degree One-Hand Dashboard Phone Mount
View on Amazon ★ 61
★ 61Toddler Car Seat Snack and Cup Tray
View on Amazon ★ 17,839
Qifutan Vent Phone Mount (Military-Grade Clip)
View on Amazon ★ 96,686
PULIDIKI Car Cleaning Gel (Detailing Putty)
View on AmazonRead, Plan, Then Stay Current
Explore our expert articles to understand incentives and ownership costs, use the map to pressure-test charging reality, then subscribe so new EV coverage comes straight to you.
Continue Reading
How Long to Charge an EV: The Three Numbers That Matter
Public EV Chargers in Canada: The Number That Gets Quoted and the One That Doesn't
How Long Does It Take to Charge an Electric Car? (2026 Guide)
EV Charging in Canada 2026: Complete Network, Cost and Home Setup Guide

GM Energy Pass: One Universal Interface For Public Charging